
18.3. Galaxy classification
There is much more to galaxies than their overall luminosity or stellar mass. At a given luminosity, galaxies can have widely different morphologies, colors, star-formation rates, etc. These additional properties and their correlations with each other and with luminosity or stellar mass are highly important for understanding the formation and evolution of galaxies.
One of the most obvious and striking properties of a galaxy is its two- or three-dimensional appearance, referred to as its morphology. The field of galaxy morphology is still dominated by discussions of a galaxy’s Hubble type, after the early work by Hubble (1926) on morphological classification. Hubble popularized a galaxy classification scheme known as the Hubble tuning fork. The earliest and simplest version of this scheme places elliptical galaxies on the left, spiral galaxies on the right, and it does not bother much with galaxies that do not confirm to these categories, which are simply labeled as irregular. Figure 18.17 displays a simple version of the Hubble tuning fork to illustrate the classical Hubble classification scheme.
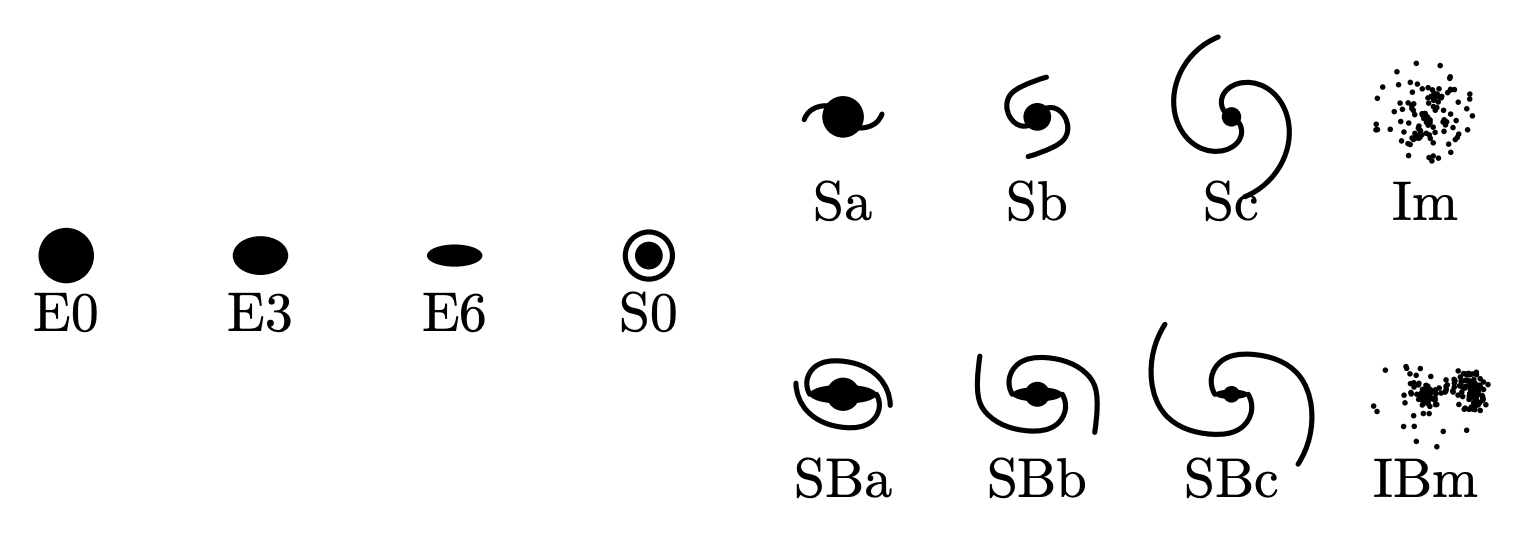
Figure 18.17: The Hubble tuning fork (Abraham 1998).
We discussed the morphological classification of elliptical galaxies in Chapter 12.1, where we saw that most elliptical galaxies have a projected shape that is well-represented as eccentric ellipses with constant axis ratio \(b/a\) and ellipticity \(\varepsilon = 1-b/a\). Using this projected ellipticity to define the morphological type as \(\mathrm{E}[10\varepsilon]\) (where \([\cdot]\) rounds to the nearest integer), elliptical galaxies are then ordered in the Hubble tuning fork by ellipticity, starting at the left with \(\varepsilon=0\) (E0) and progressing to \(\varepsilon = 0.7\) (E7).
Projected ellipticity is not a useful description of the appearance of spiral galaxies, so the morphological classification of spiral galaxies in the Hubble tuning fork focuses on the defining features of disk galaxies: spiral structure, the bulge-to-disk ratio, and the presence or absence of a central bar. The right side of the Hubble tuning fork has two sequences for spiral galaxies, one upper one for galaxies lacking a bar and one lower one for galaxies with a bar. Along these two sequences, galaxies are ordered by how tightly wound their spiral structure is, with more open spiral structure on the right. Quantitatively, the tightness of the spiral structure is assessed using its pitch angle: the angle between the tangents to a spiral and a circle through the same point (see further discussion in Chapter 20.3.1 and Figure 20.31 in particular). Small values of the pitch angle correspond to tightly-wound spiral structure and are thus displayed on the left of the spiral sequences. The pitch angle can be measured all along spiral arms and it does not always have a constant value with radius, but by-and-large spiral patterns can be assigned a single value of the pitch angle used in their classification. In addition to the pitch angle, the brightness of the central bulge component is used, with brighter bulges on the left. Bulge brightness and pitch angle are strongly (anti-)correlated, so they largely agree on where a galaxy lies in the spiral sequence, but historically the spiral classification has been subjective. Hubble divided spiral galaxies in three classes along each spiral sequence: (i) Sa for galaxies with a bright bulge and tightly-wound spiral structure, (ii) Sc for galaxies with a less prominent bulge and loosely-wound spiral structure, and (iii) Sb galaxies that are intermediate between these two. The parallel barred sequence is indicated by adding a capital “B”, as in “SBa”, “SBb”, and “SBd”. de Vaucouleurs (1959) added a fourth category Sd/SBd, for galaxies with spiral structure that is very loosely wound and with almost no bulge to speak of. To symmetrize the naming of the unbarred/barred spiral galaxies, sometimes “SAa” is used to indicated an Sa-type galaxy without a bar, similar to the SBa Sa-type galaxy with a bar. Because the classification is subjective, many galaxies exist at the boundaries between types and these are given classifications that are intermediate between two or more types, e.g., “SABa” for an Sa-type galaxy where it is ambiguous whether or not it has a bar, “Sab” for a galaxy intermediate between Sa and Sb, and so on.
In the Hubble classification scheme, the elliptical and spiral sequences are linked up at a galaxy type that is intermediate between elliptical and spiral, the so-called “S0” or lenticular galaxies. These are galaxies with a disk, but no spiral structure. They often have significant dust (unlike elliptical galaxies), but little recent star formation. Hubble thought of his tuning fork as representing an evolutionary sequence, with galaxies forming early on at the left side of the diagram as round elliptical galaxies and later evolving into spiral galaxies on the right. While this is now known to be an incorrect picture, referring to elliptical galaxies as early types and spiral galaxies as late types has stuck.
Any galaxy that does not conform to the basic elliptical, spiral, or lenticular types is labeled as an irregular galaxy in the Hubble scheme. These can be further subdivided into barred irregular galaxies IBm (like the Large Magellanic Cloud) and unbarred irregular galaxies Im. The irregular-galaxy category contains many of the zoo of smaller galaxy types (dwarf ellipticals, blue compact dwarf galaxies, dwarf spheroidal galaxies, etc.).
The Hubble classification scheme works well in the nearby, low-redshift Universe, where the majority of luminous galaxies conforms to one of the basic elliptical, spiral, or lenticular types. This is clear from the local luminosity function split by morphological type in Figure 18.9: irregular galaxies and dwarf ellipticals only start dominating the luminosity function a few magnitudes below \(L^*\). As we discussed above, while low-luminosity, irregular galaxies dominate the number density of galaxies, \(L^*\) galaxies dominate the luminosity density. Therefore, a typical star in the low-redshift Universe lives in one of the basic types of galaxies in the Hubble classification scheme.
The Hubble tuning fork looks different at higher redshifts and somewhat loses its usefulness. First of all, barred galaxies become rare at \(z \gtrsim 0.5\) (Abraham et al. 1999; Sheth et al. 2008). Thus, the spiral sequences essentially collapse to a single sequence. Secondly, at \(z \gtrsim 1\), many more galaxies have non-regular morphologies that cause them to be labeled as “irregular” (Brinchmann et al. 1998; Driver et al. 1998) and this fraction increases rapidly with increasing redshift. Figure 18.18 displays the fraction of visually-classified elliptical (labeled ‘spheroids’), disk, and irregular massive galaxies (\(M_* > 10^{10}\,M_\odot\)) as a function of redshift over \(1 < z < 3\) determined using CANDELS data (Grogin et al. 2011), showing that by \(z \approx 2\), the majority of massive galaxies are irregular.
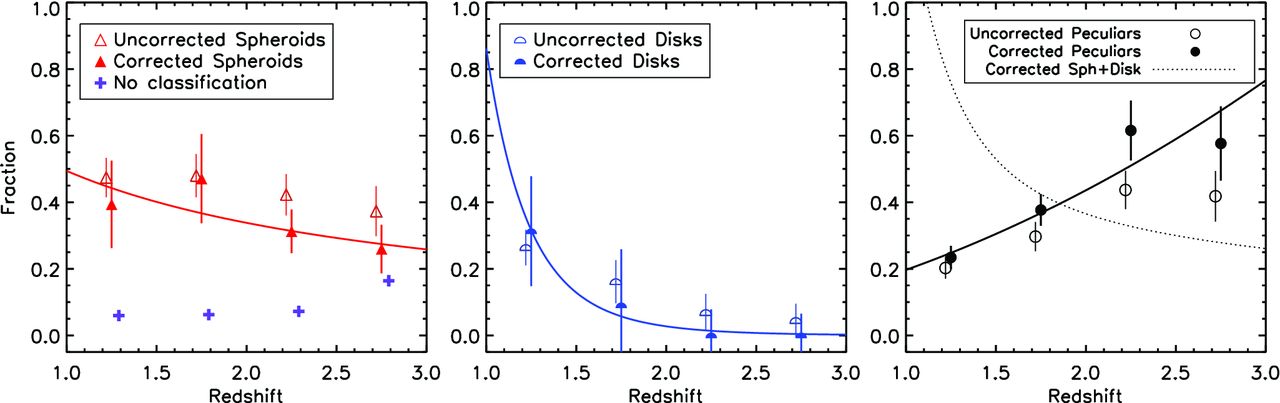
Figure 18.18: Morphological galaxy types at \(z > 1\) (Mortlock et al. 2013).
Refinements and extensions to the original Hubble classification scheme have been made over the years, but these are currently of limited interest. Modern work on galaxy morphology uses quantitative determinations of morphology to create well-defined classes of objects. For example, one can use the parameter \(n\) in a Sérsic-profile fit (see Equation 12.3) of a galaxy’s photometry to quantitatively distinguish between elliptical and disk galaxies or use a non-parametric statistic such as the Gini coefficient (Abraham et al. 2003) to classify galaxies.
Once one goes beyond the classical Hubble types ‘elliptical’, ‘lenticular’, and ‘spiral’, there is a zoo of other galaxy types used to describe observed galaxies. While galaxy formation likely produces galaxies with a continuous range of properties such that divisions into discrete classes are not always fundamental, galaxy types are still used extensively in extragalactic astronomy. It is, therefore, still useful to know about them. As discussed above, the classical Hubble diagram classifies most luminous (\(L \gtrsim 10^{10}\,L_\odot\)), low redshift (\(z \lesssim 1\)) galaxies well (with the notable exception of merging galaxies, which are classified as irregular). But at lower luminosities and higher redshifts, new galaxy types need to be introduced, with some of the main ones being:
Dwarf ellipticals (dEs): smaller versions of the classical elliptical galaxies that are often found in clusters. Their surface brightness follows a Sérsic profile with \(n \approx 1\), that is, an exponential profile as opposed to the de Vaucouleurs \(n=4\) profile that describes luminous elliptical galaxies. However, it is likely that dwarf ellipticals are simply the continuous, low-luminosity tail of a broader class of elliptical galaxies that starts at the most luminous one, with Sérsic index \(n\) decreasing towards lower luminosity. In the Local Group, NGC 147 and NGC 185 are examples of dwarf ellipticals.
Dwarf spirals: like dwarf ellipticals, the smaller counterparts of the classical, luminous spiral galaxies. But unlike dwarf ellipticals, they are quite rare.
Dwarf irregulars (dIrrs): again the lower luminosity counterparts of the classical irregular galaxies.
Low-surface brightness galaxies (LSBs): an observationally-defined galaxy type representing all diffuse galaxies with low surface brightness. In detail, they can be defined as those galaxies with a surface brightness at least one magnitude lower than that of the night sky at a dark site, which is \(\approx 22\,\mathrm{mag\,arcsec}^{-2}\) (Garstang 1989). Some LSBs are massive disks, but most are dwarf galaxies. While many of the galaxy types that we describe below are low-surface brightness galaxies, the term is often used specifically for galaxies with high gas-to-stellar mass ratios, such that most of their baryons are in non-luminous gaseous form. These galaxies have been used extensively to probe the inner structure of dark matter halos and compare it to theoretical predictions, with observations of LSBs favoring cored dark-matter profiles, while dark-matter only simulations predict cuspy profiles (e.g., Oh et al. 2011; the problem goes away when including baryonic feedback in the simulations, Pontzen & Governato 2012; see the extended discussion in Chapter 6.8).
LSBs are probably common in the Universe, but they are difficult to detect due to their low surface brightness. For example, the detection efficiency of large surveys such as SDSS drops steeply at the \(23\,\mathrm{mag\,arcsec}^{-2}\) threshold for the definition of LSBs (Blanton et al. 2005).
Dwarf spheroidal galaxies (dSphs): a class of low-luminosity, spheroidal galaxies, similar to dwarf ellipticals, but generally closer to spherical and extending to lower luminosities. They are typically dominated by old stellar populations and have little to no gas. They extend down to very low surface brightnesses, with the lowest surface brightness objects likely yet to be discovered. The lowest-luminosity, lowest surface brightness dSphs are known as ultra-faint dSphs. Because of their extremely low luminosity, most known dSphs are in the Local Group (McConnachie 2012), with examples including the classical Milky-Way satellites Fornax, Sculptor, and Draco, and the merging Sgr dSph (Ibata et al. 1994). Ultra-faint dSphs (UFDs) can only be detected in the Local Group (e.g., Willman et al. 2005; Belokurov et al. 2007; Bechtol et al. 2015), but most galaxies in the Universe by number are likely dSphs (we just cannot see them).
As discussed in Chapter 6.5, dSphs are highly dominated by dark matter with total mass-to-light ratios of 10 to 100 and they are, therefore, useful laboratories for studying dark matter.
Ultra-diffuse galaxies (UDGs): similar to dwarf ellipticals, ultra-diffuse galaxies are small elliptical galaxies found in cluster environments, but they are more extended at a given luminosity, causing their surface brightness to be very low. The existence of extended dwarf-elliptical-like galaxies has been known for decades (e.g., Sandage & Binggeli 1984), but UDGs have recently become a topic of increasing interest due to the discovery of a large population of them in the Coma cluster (van Dokkum et al. 2015a; Koda et al. 2015). van Dokkum et al. (2015a) define UDGs to have effective radii \(> 1.5\,\mathrm{kpc}\) and a central surface brightness \(\gtrsim 24\,\mathrm{mag\,arcsec}^{-2}\). Observed UDGs have surface brightnesses down to a few magnitudes fainter than this defining limit, but the low surface-brightness limit is caused by a rapidly-decreasing detection efficiency and there may well be many even lower surface-brightness galaxies. UDGs have puzzling dark-matter content (e.g., Dragonfly 44 with more-than-usual dark matter as discussed in Chapter 6.7, while UDG NGC1052-DF2 seemingly lacks dark matter; van Dokkum et al. 2018).
Many of these various types of galaxies are shown on a plane of their luminosity versus an indication of their size in Figure 18.19: effective radius on the left and central surface brightness on the right. The central surface brightness at a given luminosity is indicative of a galaxy’s size and by comparing the two panels, it is clear that central surface brightness more cleanly visualizes the distinctions between the different galaxy types. The most luminous galaxies are large ellipticals, which despite their large size are also the most compact galaxies. Spiral galaxies have similar effective radii as ellipticals, but their lower typical luminosities imply that their central surface brightnesses are smaller. Large spiral galaxies in fact span only a narrow range in central surface brightness at \(\approx 21\,\mathrm{mag\,arcsec}^{-2}\), a result known as Freeman’s law (Freeman 1970). Extending down from spirals towards lower luminosities, surface brightnesses, and effective radii are the various types of LSBs: UDGs, dSphs, and UFDs; dEs appear in this area as well (DWs in the figure). UFDs are the lowest surface-brightness galaxies known. At the high surface-brightness end, ultra-compact dwarfs (UCDs; high-density objects found typically near the center of galaxy clusters) span the space between ellipticals and globular clusters (GCs; not galaxies, but shown here as an additional stellar system of interest).
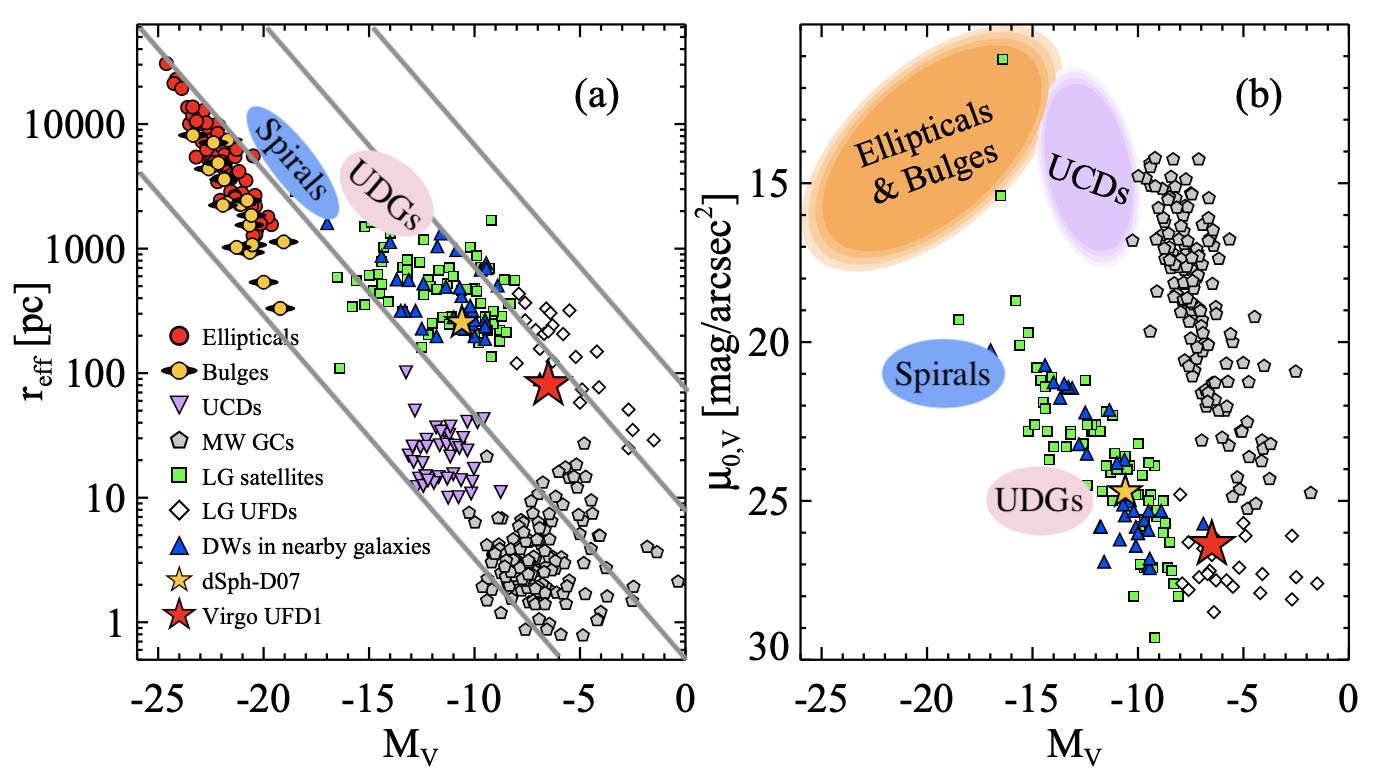
Figure 18.19: Galaxy size vs. luminosity for different types of galaxies. Adapted from Jang & Lee (2014), with ‘Spirals’ location from Binggeli (1994) and ‘UDGs’ location from van Dokkum et al. (2015b); lines of constant surface brightness are shown in the left panel.
The second set of important properties of galaxies in addition to their morphological features are their photometric and spectroscopic properties. By this we mean properties such as their broadband colors, spectroscopic indices, and derived properties such as the present star-formation rate, age, and metallicity. We will present most of these in detail in Section 18.5 below, but start here with a brief discussion on what can be learned from the broadband properties.
At low redshift and for galaxies with surface brightnesses \(\lesssim 23\,\mathrm{mag\,arcsec}^{-2}\), the SDSS has provided the definitive distribution of broadband photometric properties of galaxies. The luminosities (as absolute magnitude in the \(r\) band) and optical \(g-r\) colors of SDSS galaxies are shown in Figure 18.20, which also includes their correlations with some of the important morphological properties, Sérsic index \(n\) and effective radius (denoted as \(r_{50}\) in this figure).
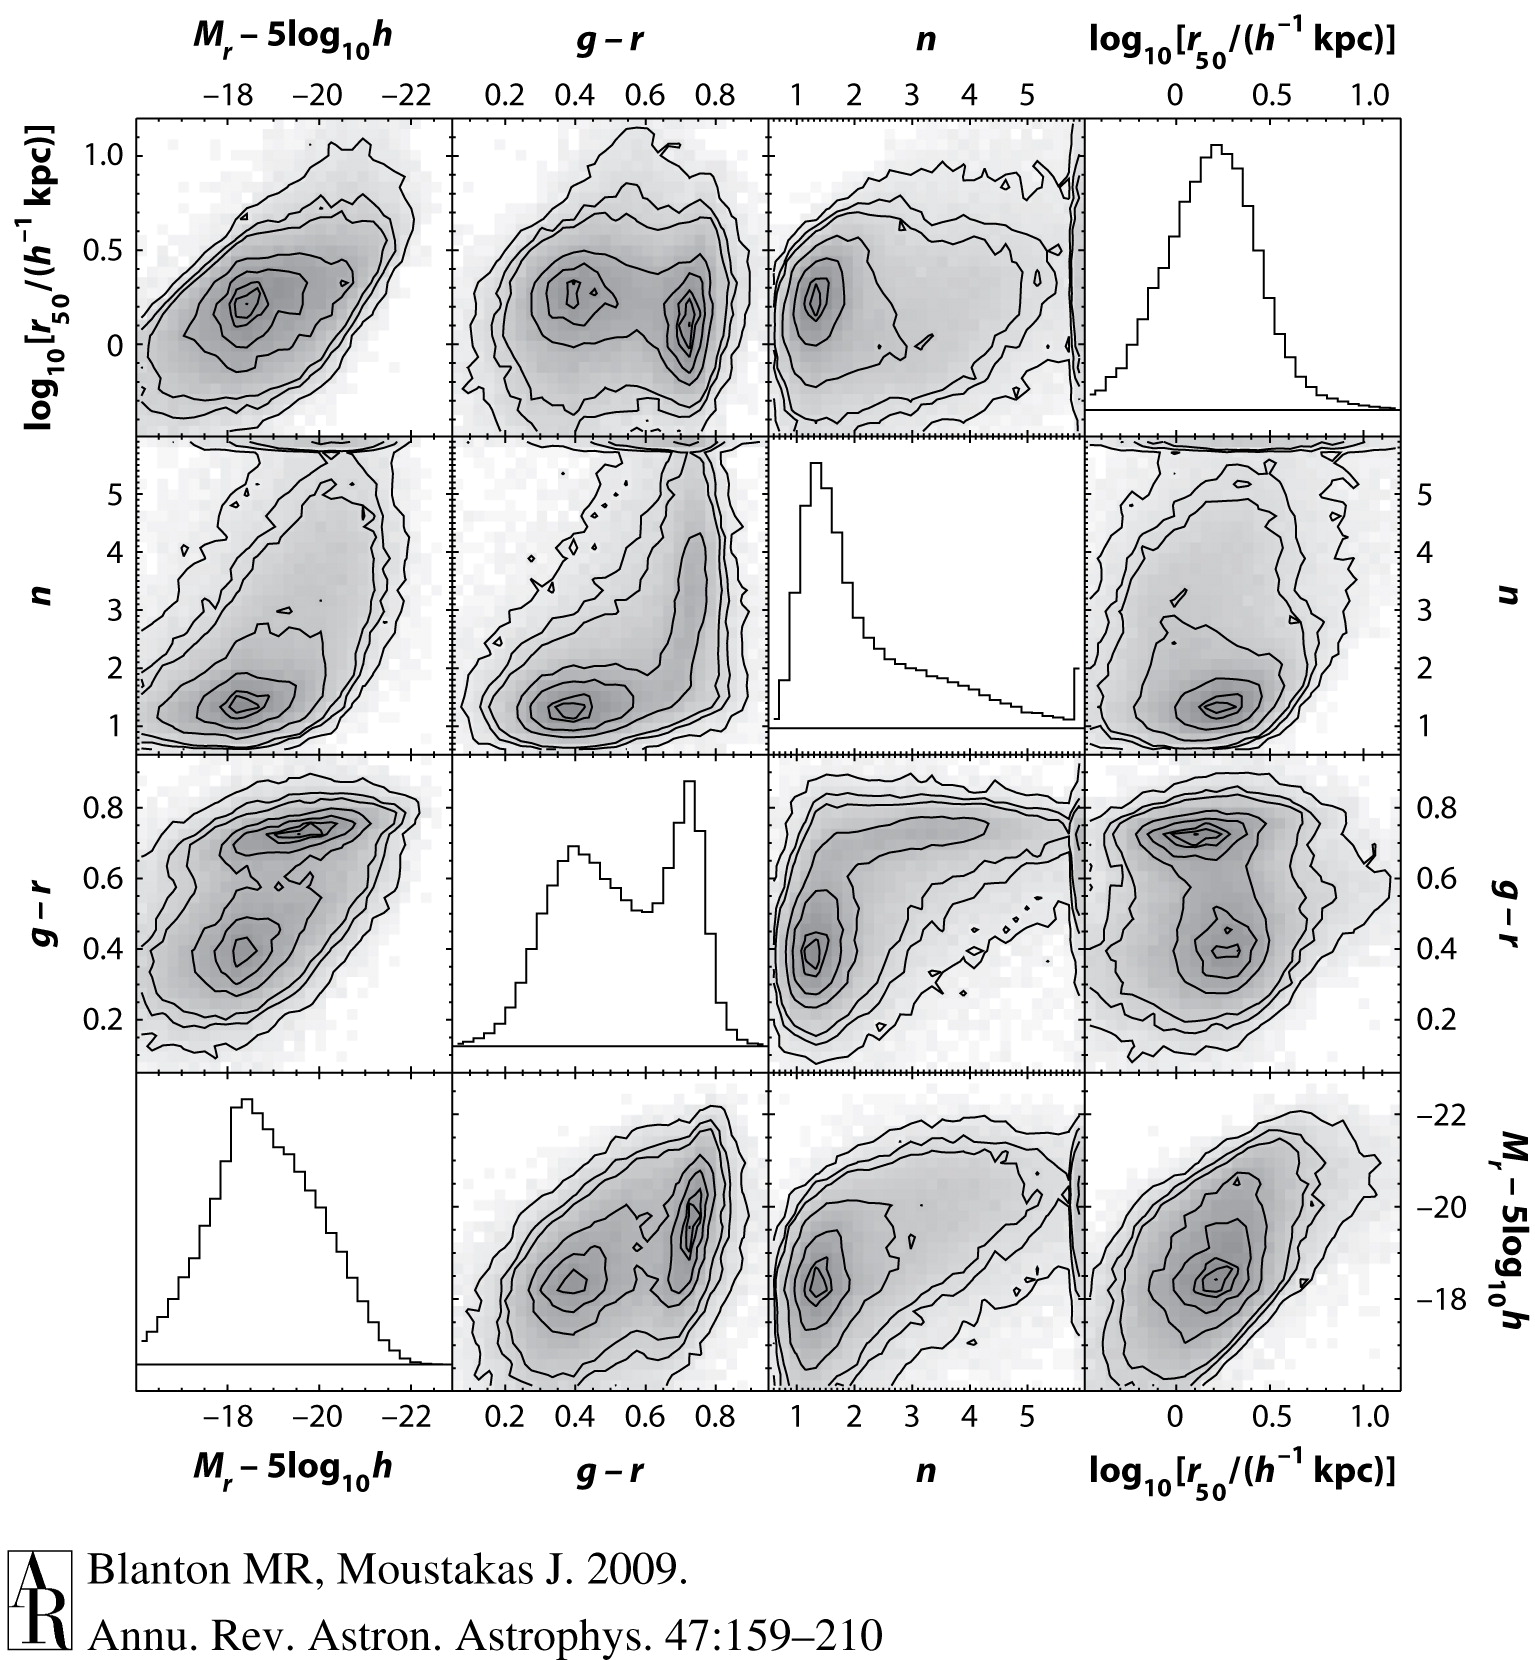
Figure 18.20: Broadband photometric galaxy properties at low redshift (Blanton & Moustakas 2009).
The most striking aspect of these distributions is that the color distribution is bimodal (Strateva et al. 2001; Blanton et al. 2003a; Baldry et al. 2004), with a narrow red peak and a broad blue peak separated by a valley. The correlation between color \(g-r\) and Sérsic index \(n\) demonstrates that the blue peak has \(n\approx 1\), corresponding to an exponential profile, while the red peak has \(2 \lesssim n \lesssim 4\), with the reddest galaxies having de Vaucouleurs profiles (\(n=4\)). In the color-magnitude diagram, the red peak is a narrow “red sequence” with increasing luminosity for redder galaxies; the blue color peak is a broad “blue cloud”. The valley separating the blue cloud and the red sequence is known as the green valley (Bell et al. 2004); the Milky Way is believed to be part of the green valley (Mutch et al. 2011). A comparison with the classical morphological types shows that the red sequence largely consists of elliptical galaxies, while the blue cloud holds spiral galaxies. The red color of red-sequence galaxies is caused by their lack of recent star formation; blue-cloud galaxies are typically star-forming disks. Because luminosity correlates well with stellar mass and color with the amount of recent star formation, similar bimodal sequences exist in plots of star-formation rate or indicators of it such as the \(4000\,\AA\) break versus stellar mass (see Section 18.5 below). Surveys of high-redshift galaxies show that the bimodal galaxy color distribution exists at least as far back as \(z\approx 3\) (Brammer et al. 2009; Whitaker et al. 2011).
As we demonstrated in Section 18.1 above, the spectral energy distribution of a galaxy consisting of stars and some interstellar gas consists of (i) broad optical-through-near-infrared emission from stars, (ii) narrow emission lines of neutral and ionized gas, and (iii) mid-to-far-infrared emission from dust grains heated by starlight. The presence of large numbers of young stars tends to lead to a broader spectral energy distribution (SED) that includes direct ultraviolet radiation from the high-energy tail of the stars’ blackbody emission and substantial far-infrared emission from dust grains heated by the intense radiation field near young stars. Because all of this emission is essentially black-body emission of stars and dust grains at different temperatures, this type of radiation is referred to as thermal. Non-thermal radiation that results from, e.g., high-energy particles accelerating in magnetic fields, and that leads to strong emission in the radio and far-ultraviolet/X-ray regions of the electromagnetic spectrum, is rare in galaxies. But in a small fraction of galaxies—approximately 1% of luminous spirals and ellipticals—the central region displays broad SEDs with strong non-thermal emission—the centers of galaxies in this context are generally referred to as nuclei. This broad, non-thermal, nuclear emission is often accompanied by prominent emission lines that in many instances have linewidths indicative of motions of 1000s of \(\mathrm{km\,s}^{-1}\) and whose strength requires a “hard” radiation spectrum (a spectrum tilted towards high energies). The luminosity of the non-thermal nuclear emission is always much higher than the thermal emission from an equivalently-sided region would be and it often exceeds—sometimes by orders of magnitude—the total thermal luminosity of the galaxy. In these galaxies, the non-thermal radio and X-ray/gamma-ray emission often extends to large radii (e.g., the gamma-ray emission in Cen A shown in purple in Figure 1.1). Galaxies with these properties are referred to as active galaxies and the central region from which much of the non-thermal emission originates is known as an active galactic nucleus (AGN; Ambartsumian 1958).
While these days we believe that all types of AGN are essentially the same underlying physical phenomenon that manifests itself in different ways observationally due to the random effects of, e.g., dust obscuration and viewing angle, the historical observationally-defined classes of AGN are still in common use and remain a useful classification. The main classes of AGN are the following:
Seyfert galaxies were the first AGN to be identified, from their bright star-like nuclear regions with non-thermal SEDs (Seyfert 1943). Usually hosted by spiral or irregular galaxies, Seyfert galaxies are divided into two classes: Seyfert 1 galaxies, which have unusually broad emission lines in addition to narrow emission lines and non-thermal continuum spectra, and Seyfert 2 galaxies, which only have narrow emission lines and which display less strong non-thermal continua. In Seyfert 1 galaxies, the width of the broad emission lines corresponds to gas-cloud motions of thousands of \(\mathrm{km\,s}^{-1}\); the width of the narrow emission lines corresponds to motions of hundreds of \(\mathrm{km\,s}^{-1}\). LINERs (low-ionization nuclear emission line regions) are the low-luminosity extension of Seyfert 2 galaxies.
Radio galaxies are galaxies with radio luminosities well above the normal range for spiral galaxies (which mainly produce radio emission in supernova remnants). Optical follow-up of these galaxies that were first discovered in radio surveys shows that they display similar non-thermal spectra characterized by broad and/or narrow emission lines as Seyfert galaxies, but their hosts are typically elliptical galaxies. The radio emission often extends to large distances and in strong radio sources often takes the form of two widely-separated blobs extending to tens of kpc and up to several Mpc. These blobs are connected to the galactic nucleus by a narrow jet. These are Fanaroff-Riley Class II objects in the morphological classification introduced by Fanaroff & Riley (1974) (in which Fanaroff-Riley Class I objects are smaller, weaker sources). Generally, only one jet connecting the nucleus to a radio blob is visible, because relativistic beaming in the fast-moving jet significantly affects their observed intensity.
The term quasars, or QSOs, was originally used as a designation of the unresolved optical counterparts of strong, compact radio sources, leading to the name quasi-stellar object (QSO) or quasi-stellar radio source (hence, quasar). In quasars, the AGN luminosity is so large as to make the host galaxy almost entirely undetectable, although deep observations demonstrate that quasar hosts span a wide range of galaxies (from normal ellipticals and spirals, to disturbed and merging galaxies; Bahcall et al. 1997). Schmidt (1963a) famously determined the redshift of the quasar 3C 273, a strong compact radio source in the 3C survey (Edge et al. 1959) and the brightest quasar in the sky. Schmidt (1963a)’s realization that the emission lines in the spectrum implied a redshift of 0.158 demonstrated that the source’s luminosity is extremely high with an absolute magnitude of \(-26.7\), a hundred times more luminous than typical large galaxies. Nowadays, the term quasar is applied broadly to any AGN at cosmological distances (such that there are such things as radio-quiet quasars).
Blazars, BL Lac objects, and optically violently variables (OVVs). All AGN display strong variability on a large variety of timescales, but optically violent variables display especially rapid variability on time scales as short as hours and even shorter time scales at shorter wavelengths. BL Lac objects similarly display high variability, but without the emission lines characteristic of other AGN. Blazars are a more general term for violently-variable AGN. All of these are considered to result from staring (almost) straight down the jet launched by the AGN: in radio galaxies we see these jets as they are launched transverse to our line of sight, but in blazars we happen to be staring straight down the jet. AGN variability provides one way to estimate the size of AGN, because the observed intensity of an unresolved source can only vary on time scales larger than the light crossing time. As AGN are observed to vary on hour time scales in the optical and minute time scales in X-rays, the size of the emission region where the continuum emission is produced must be smaller than \(\approx c\times(1\,\mathrm{min.\ to}\,1\,\mathrm{hr}) = \mathcal{O}(1\,\mathrm{AU})\).
Essentially all of the observed phenomenology of AGN and quasars can be explained as deriving from the accretion of gas onto a central supermassive black holes (SMBH) in a complex environment (e.g., Ambartsumian 1958; Salpeter 1964; Zel'dovich 1964; Ambartsumian 1965; Lynden-Bell 1969; Rees 1984). We already discussed the many lines of evidence for the existence of SMBHs at the centers of large galaxies in Chapter 16.1 as well as the Soltan argument, which explains the mass density of SMBHs today in terms of the total luminosity density of quasars at high redshift by assuming that the quasar luminosity results from accretion onto an SMBH. The minimum \(\approx\)AU size of the AGN emission region determined from its variability is similar to the Schwarzschild radius of the \(\approx 10^8\,M_\odot\) SMBHs present in large galaxies, demonstrating that the continuum emission must occur in the strongly-relativistic regime near the SMBH. In the Unified Model of AGN essentially all of the observed phenomenology results from viewing-angle differences of a single physical enviroment (e.g., Lawrence & Elvis 1982; Antonucci & Miller 1985; Antonucci 1993) in roughly the following way: (i) the continuum X-ray–through–optical emission results from an \(\mathcal{O}(10\,\mathrm{AU})\)-scale accretion disk around the SMBH, surrounded by (ii) an \(\mathcal{O}(0.1\,\mathrm{pc})\)-scale broad-line region of fast-moving gas clouds that gives rise to the broad emission lines (in detail, the size of this region scales approximately as the square root of the continuum luminosity; e.g., Bentz et al. 2013). The broad-line region is surrounded by (iii) a dusty torus that extends out to tens to hundreds of parsecs and gives rise to mid-infrared emission and that can obscure the broad-line emission when viewed edge-on, thus giving rise to, e.g., Seyfert 2 galaxies. The (iv) narrow-line region of slower-moving gas clouds where the narrow emission lines are formed lies outside of the dusty torus and can extend out to multiple kpc; because it lies outside of the dusty torus, narrow, high-excitation emission lines are usually observed in AGN. Back near the center, strong magnetic fields interacting with the SMBH launch (v) powerful jets of relativistic particles that culminate in radio lobes and that radiate through synchrotron radiation as well as inverse Compton scattering and Bremsstrahlung (see Chapter 19.3.1). When looking close to the jet direction, we observe a blazar in which the emission is dominated by relativistically-beamed synchrotron emission.
While AGN only occur in about one percent of galaxies, a variety of observations point towards the view that all galaxies go through short periods of AGN activity from time to time. For example, estimated quasar lifetimes are \(\approx 5\times 10^7\,\mathrm{yr}\) (e.g., Martini & Weinberg 2001; Yu & Tremaine 2002) or about 0.5% of the age of massive galaxies; therefore, the observed fraction of AGN is consistent with all galaxies going through AGN activity for \(\approx 1\%\) of the time. The fraction of time that a quasar is active is known as the duty cycle and it is larger at higher redshift, likely because the mergers that are probably an important driver of quasar activity (e.g., Hopkins et al. 2006) are more common at earlier times. The Soltan argument discussed in Chapter 16.1 demonstrates that the ubiquity of SMBHs in low-redshift galaxies is also easily explained if all galaxies grew SMBHs through episodes of accretion onto the SMBH, that is, quasar activity. Thus, while AGN are relatively rare, they are most likely a phase that all relatively massive galaxies pass through at one time or another.

 .
. .
. .
.