
16.5. The stellar and dark mass profiles of elliptical galaxies
Unlike disk galaxies, elliptical galaxies do not typically have thin, rotating gas disks that allow the rotation curve and enclosed mass profile to be determined with relative ease. Even in the fast rotators, the velocity dispersion provides a significant part of the support of an elliptical galaxy, such that the rotational velocity differs significantly from the circular velocity. We therefore have to resort to other methods to determine the overall mass distribution within elliptical galaxies and to separate it into the contribution from luminous and dark-matter components. In this section, we discuss how a consistent picture of the mass distribution in elliptical galaxies emerges from the combination of dynamical modeling of stellar kinematics with gravitational lensing of the strong, weak, and micro variety. We already described the basic methods and results from dynamical modeling of stellar kinematics in the previous sections, so we’ll focus on results from gravitational lensing here and discuss their relation to results from dynamical modeling along the way.
In Chapter 15.2.4, we discussed how strong lensing allows the mass within the Einstein radius to be determined in a manner that does not require assumptions of equilibrium like dynamical modeling. Einstein radii for low-redshift lenses are a few kpc (see Equation 15.49), similar to the effective radius of the light profile. Strong lensing therefore constrains the mass in the region where stars contribute significantly to the gravitational potential. However, we also saw in Chapter 15.2.4 that strong lensing is affected by the mass-sheet degeneracy, meaning that the fraction of the mass within the Einstein radius that is associated with the lens galaxy cannot be unambiguously determined. And we saw that strong lensing cannot measure the enclosed mass over a wide range of radii, but is instead limited to the mass distribution around the Einstein radius. Thus, strong lensing needs to be combined with other methods like stellar kinematics to break the mass-sheet degeneracy and to extend the mass profile measurement to smaller and larger radii.
Many strongly-lensed systems exists and their mass distributions have been analyzed, but a particularly interesting and comprehensive set of observations and analyses was performed by the Sloan Lens ACS Survey (SLACS; Bolton et al. 2006). SLACS selected a large sample of galaxy-galaxy lenses by looking for galaxy spectra in the spectroscopic database of the Sloan Digital Sky Survey (SDSS; York et al. 2000; Eisenstein et al. 2001; Strauss et al. 2002) that have multiple nebular emission lines at a redshift significantly higher than that of the SDSS target galaxy, indicating that the spectrum contains a background galaxy that is likely lensed. These candidates were then followed up with the Hubble Space Telescope’s Advanced Camera for Surveys (ACS) instrument to obtain the high-resolution imaging that can reveal whether a lensed background galaxy is in fact present. Through this procedure, SLACS discovered 70 strong-lensing systems (Bolton et al. 2008a), with many of them displaying an Einstein ring, indicating that the background source galaxy is almost exactly behind the lens galaxy. A few examples are shown in Figure 16.12.
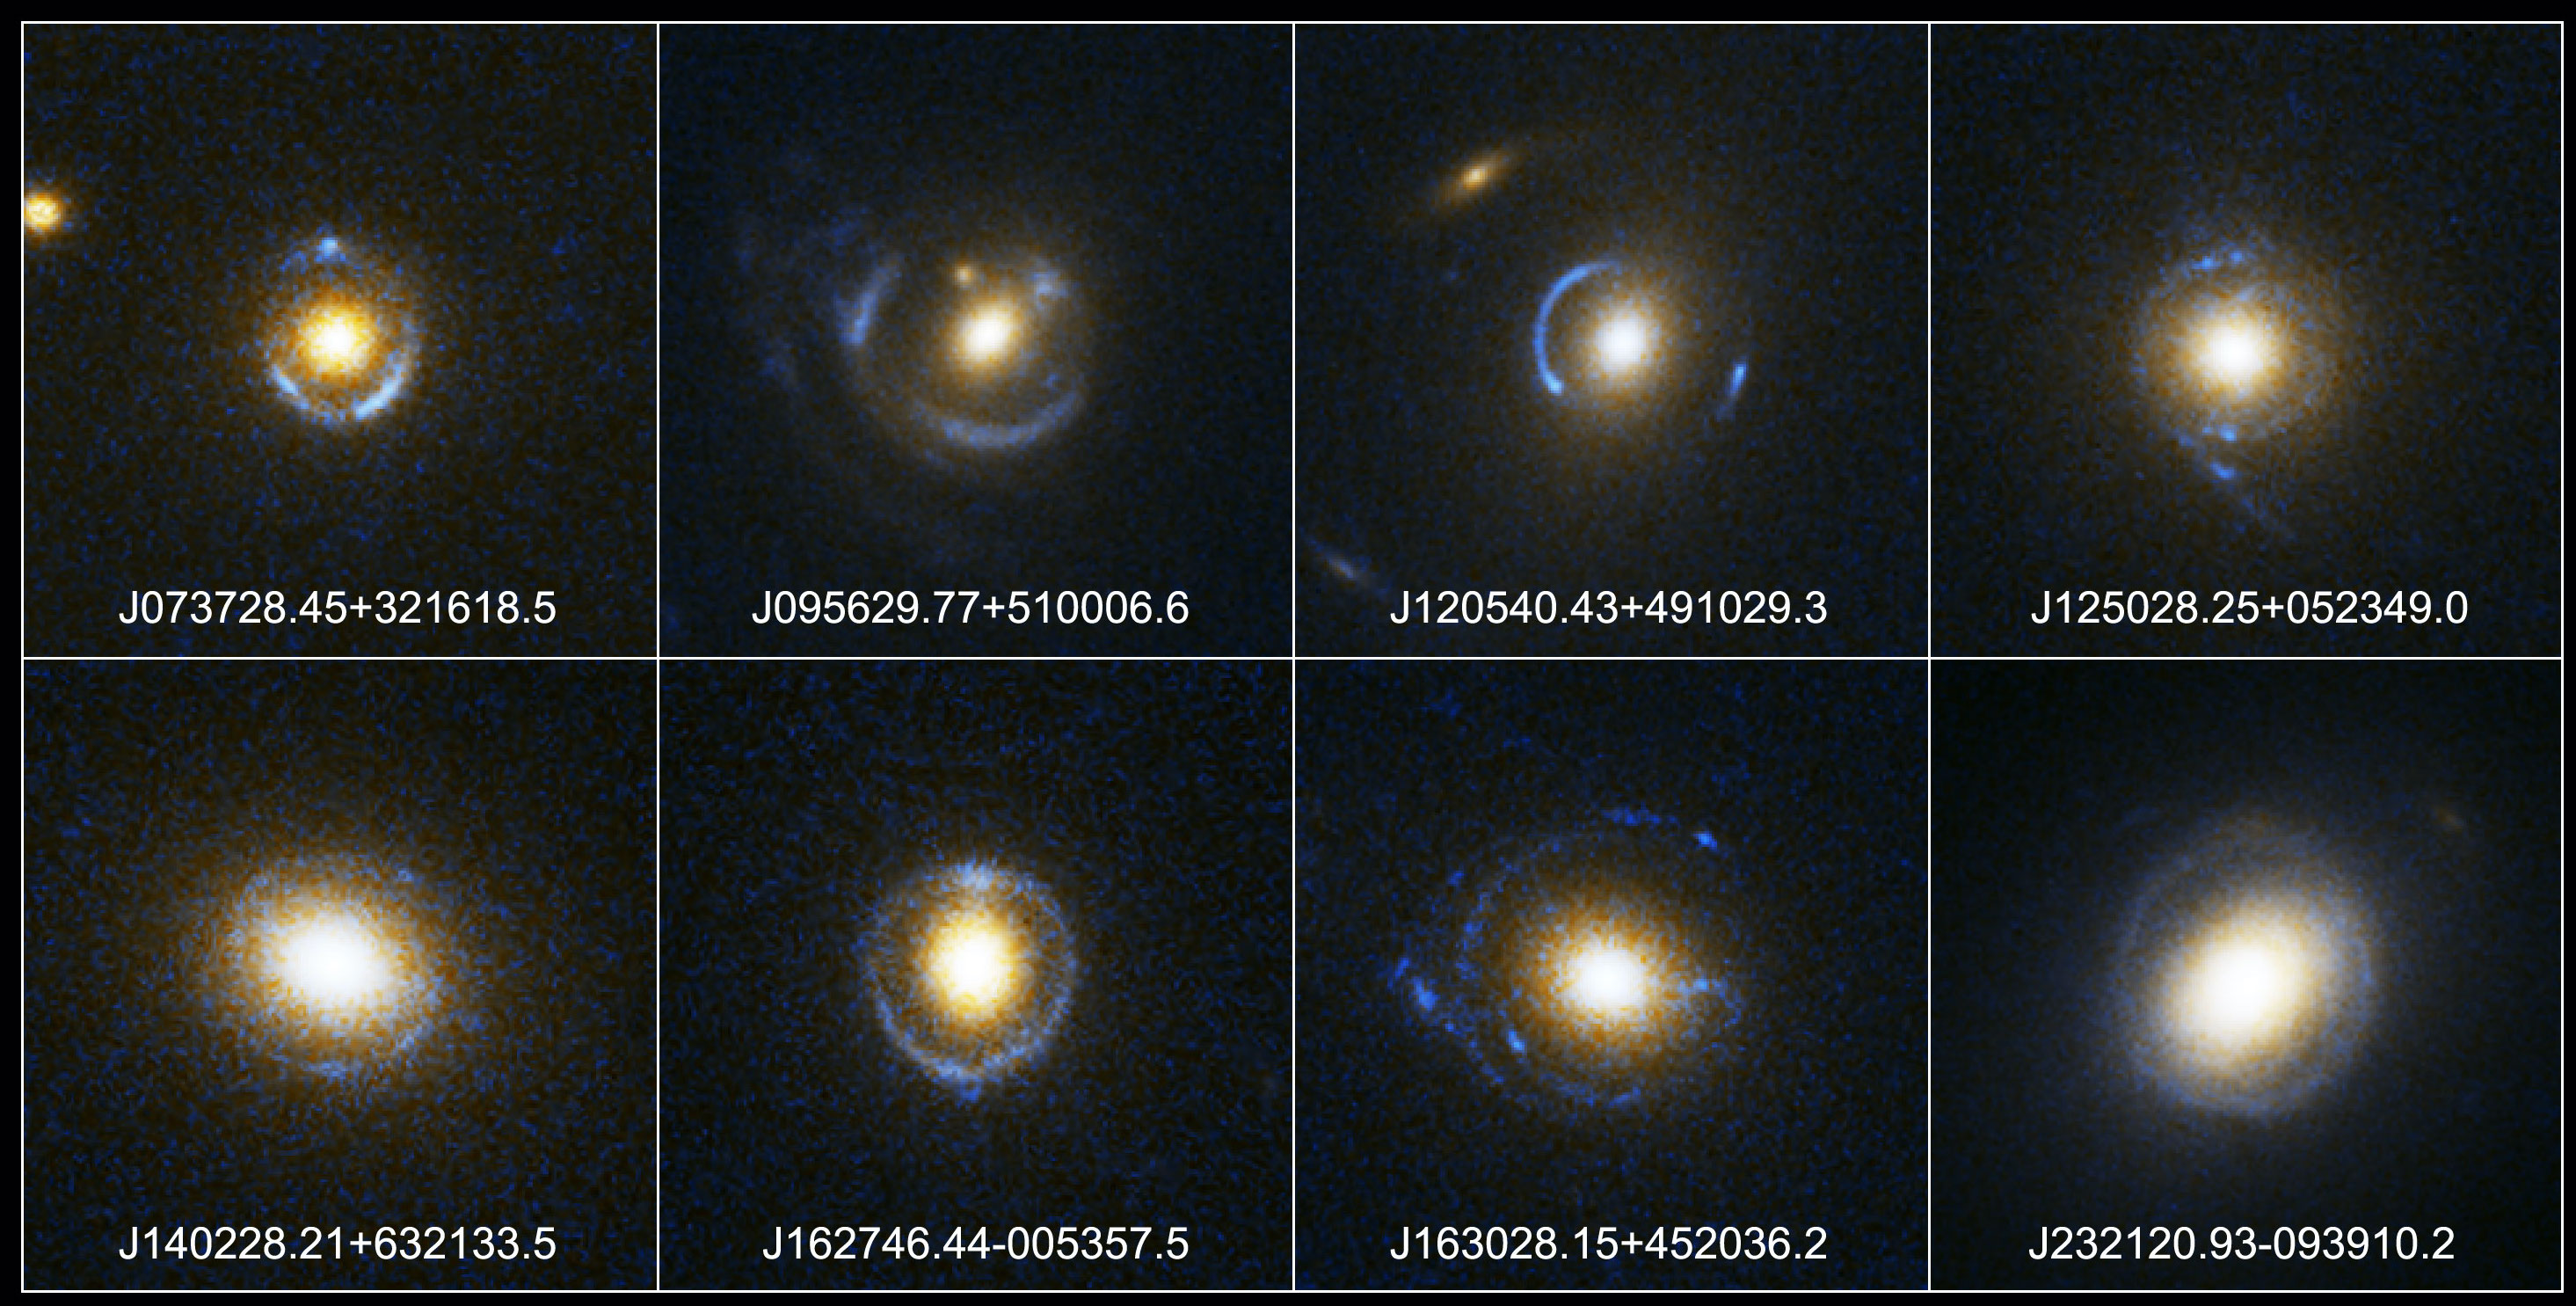
Figure 16.12: Einstein rings from the SLACS survey (NASA, ESA, and the SLACS Survey team).
The way that the SLACS lenses are found has two important implications for their use to constrain the mass distribution in elliptical galaxies. Firstly, because the lensed source galaxy is found as a second set of lines in a galaxy spectrum, the redshift of both the source and the lens is known from the outset. This is often not the case for other strong lensing systems, where either the lens or the source is too faint to obtain a spectroscopic redshift or where it simply requires expensive follow-up observations. Secondly, the SDSS spectrum of the lens also allows the velocity dispersion of the lens to be measured, which can be combined with the radius of the Einstein ring to break the mass-sheet degeneracy and constrain the mass profile through dynamical modeling. SDSS fibers have a diameter of \(3''\), so the velocity dispersion is measured within a similar radius as the Einstein ring (which has a diameter of \(\approx 2''\)).
Koopmans et al. (2009) analyzed 58 SLACS lenses combining the lensing and velocity dispersion measurements to determine the logarithmic slope of the total mass profile, approximated as a single power law \(\rho(r) \propto r^{-\gamma'}\). First using the observed Einstein rings to determine the mass within the Einstein radius, they then obtain the velocity dispersion by solving the spherical Jeans equation (5.47) for different constant values of the anisotropy \(\beta\), modeling the luminous component as a massless Hernquist or Jaffe profile with half-light radius determined by the observed profile (e.g., Treu & Koopmans 2002); the observed velocity dispersion within the \(3''\) SDSS fibers is obtained by projecting the velocity dispersion onto the line of sight and averaging it using the surface-brightness profile (see Equation 6.18). Combining the lensing and dynamical-modeling constraints, the resulting determinations of the logarithmic slope of the mass profile are shown in the left-hand panel of Figure 16.13.
|
|
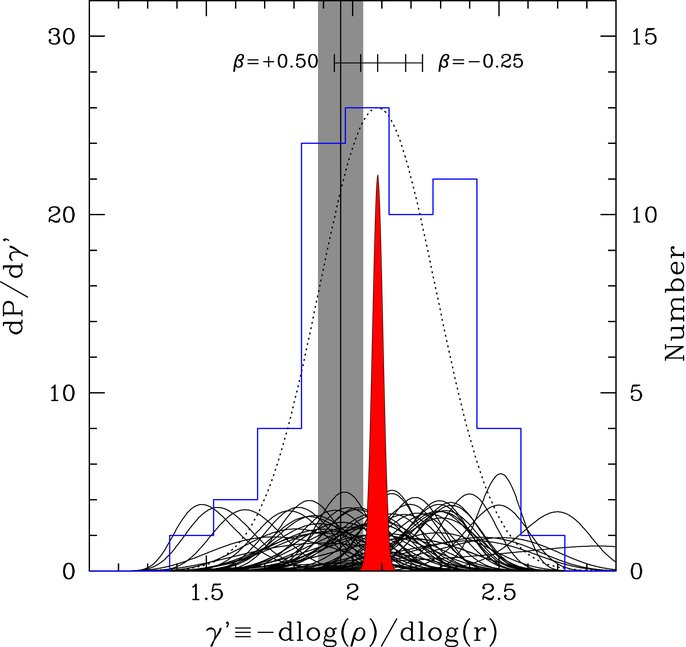
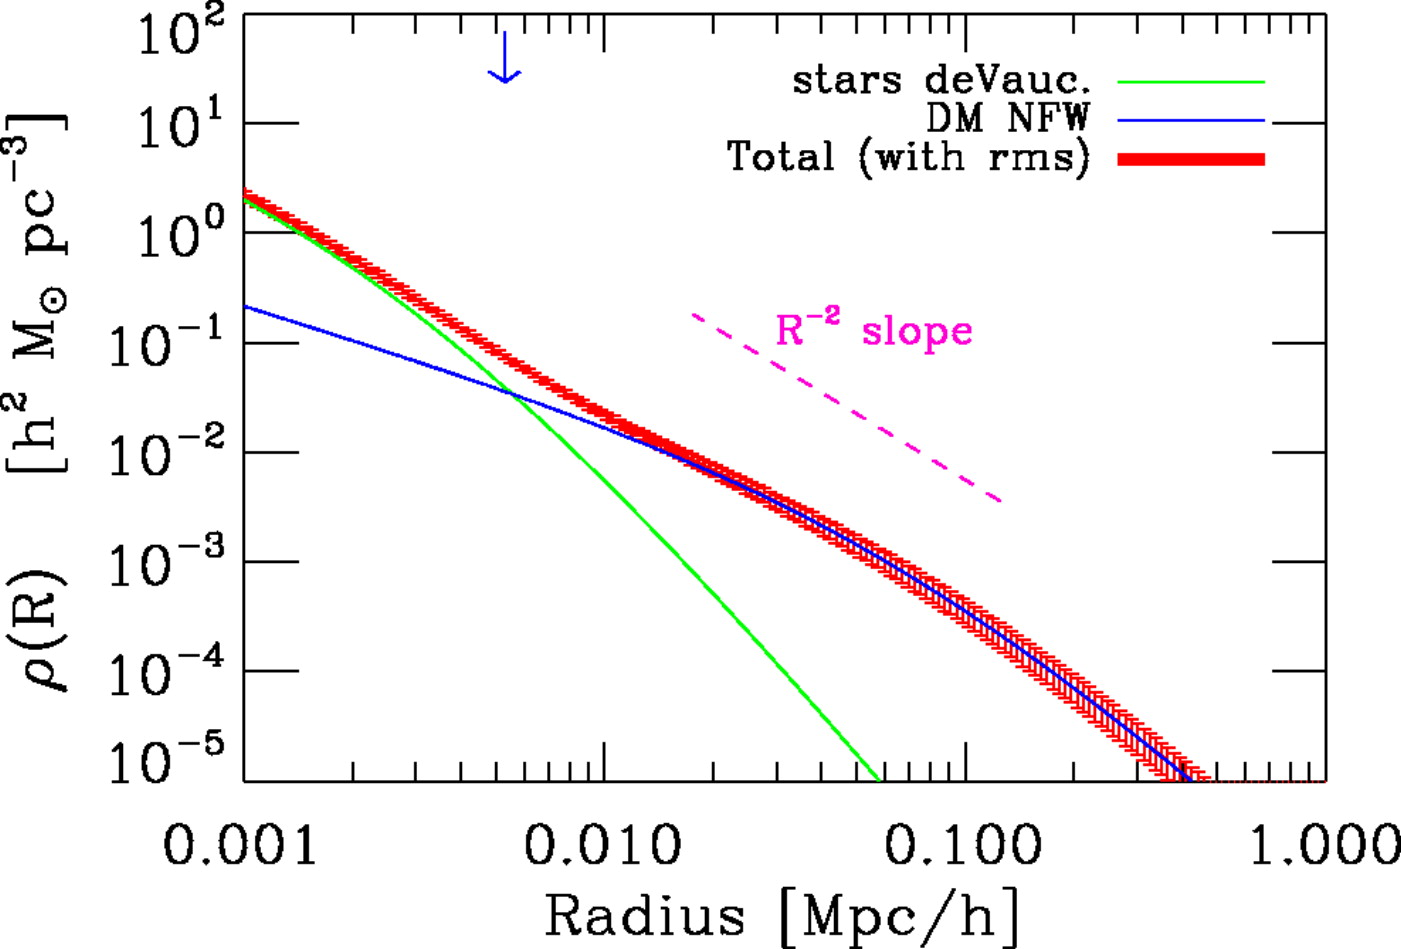
Figure 16.13: Mass profile slope \(\gamma'\) in the inner regions of elliptical galaxies from lensing and dynamical modeling (left; Koopmans et al. 2009) and extended mass profiles out to the virial radius using weak lensing (right; Gavazzi et al. 2007).
While the uncertainties in the individual \(\gamma'\) measurements are large, they all scatter around \(\gamma' \approx 2\). A joint analysis of all systems assuming \(\beta = 0\) and that they have a \(\gamma'\) drawn from a Gaussian with scatter \(\sigma_{\gamma'}\) shown by the red histogram gives \(\gamma' = 2.085\pm 0.025\) and \(\sigma_{\gamma'} = 0.20\pm0.03\).
Dynamical-modeling-only analyses of the absorption-line kinematics of stars using surveys like ATLAS\(^{\mathrm{3D}}\) confirm the \(\gamma' \approx 2\) behavior of the total mass profile (e.g., Cappellari et al. 2015). This measurement can be extended further out to about five times the effective radius with the addition of dynamical modeling of globular-cluster (e.g., Napolitano et al. 2014) or planetary-nebulae kinematics (e.g., Hui et al. 1995; Arnaboldi et al. 1996) using the dynamical modeling methods discussed so far in this book (including spherical-Jeans-equation analyses as in Romanowsky et al. 2003, JAM models as in Cappellari et al. 2015, and sophisticated made-to-measure Schwarzschild-type models as in de Lorenzi et al. 2008). Modeling the X-ray emission of hot gas in massive ellipticals assuming hydrostatic equilibrium (see Chapter 19) allows the \(\gamma' \approx 2\) profile and the presence of large amounts of dark matter to be confirmed out to ten effective radii (e.g., Humphrey et al. 2006). Thus, the total mass profile of elliptical galaxies near and beyond the Einstein radius is approximately \(\rho(r) \propto r^{-2}\). This spherical density corresponds to a flat rotation curve (see Chapter 2.4.5) or, equivalently, a singular isothermal sphere. Thus, the rotation curves of elliptical galaxies in the region where stars contribute significantly to the potential is flat just like for spiral galaxies (Chapter 8). This is remarkable given that otherwise their spatial and dynamical structure is so different!
To extend the measurement of the total mass profile to significantly larger radii, we need to use weak lensing. As we discussed in Chapter 15.3.4, the weak lensing signal from individual, even massive, galaxies is so weak that it is difficult to detect. But selecting a population of lens galaxies and assuming that they all share the same mass profile, shape measurements of background sources behind all lens galaxies can be combined to determine the typical mass profile of the population of lens galaxies. We can do this therefore for the SLACS sample of massive elliptical galaxies. As is the case with strong lensing, weak lensing suffers from the mass-sheet degeneracy, but since a mass-sheet adds a constant surface density, we can robustly determine changes in the surface density between different parts of galaxies and thus measure the profile. Gavazzi et al. (2007) presented such an analysis for 22 SLACS lenses and determined the mass profile out to \(\approx 400\,\mathrm{kpc}\), shown in the right panel of Figure 16.13. It is clear from the figure that they find that the \(\rho(r) \propto r^{-2}\) behavior extends all the way to the edge of their data, demonstrating that massive elliptical galaxies are approximately singular isothermal spheres from their Einstein radii at \(r \approx 4\,\mathrm{kpc}\) to the edge of their dark matter halo at \(r \approx 400\,\mathrm{kpc}\). The decomposition of the total mass profile into the contribution from stars and dark matter in the figure demonstrates that the \(\rho(r) \propto r^{-2}\) profile results from the superposition of two profiles with different radial dependence. That the superposition of two non-flat rotation curves produces a flat one is known as the disk-halo conspiracy. The same conspiracy happens in disk galaxies.
The large-radii weak-lensing measurements directly measure the dark-matter profile, because dark matter dominates the density at large distances from the center. To determine the distribution of dark matter within the effective radius, where stars contribute much of the mass, we need to proceed differently. One way is to perform an analysis of strong-lensing+kinematics similar to the Koopmans et al. (2009) study discussed above, but using the observed light profile to subtract the contribution from stars. This can be done by deprojecting the light into a three-dimensional distribution and using a constant mass-to-light ratio chosen such that the mass-density profile constructed from the stars does not exceed the total mass profile. This is similar in spirit to the maximum-disk fits to rotation curves discussed in Chapter 8.2, but because there is no disk in elliptical galaxies, they are known as maximum-bulge fits in this context. Alternatively, we can also use our knowledge of stellar populations and stars to constrain the mass-to-light ratio from the observed galaxy spectrum. This method that can determine the age, abundance, and stellar mass-to-light ratio from modeling observed spectra as a superposition of many stars is known as stellar-population synthesis (SPS; discussed in detail in Chapter 18.1) . With the mass-to-light ratio obtained from SPS, the contribution from stars to the total stellar mass profile can be subtracted and the dark-matter profile is revealed.
To better constrain the inner dark-matter profile, we can further make use of integral-field spectroscopic (IFS) measurements of the kinematics of the lensing galaxy and model these in the same way as the modeling of the SAURON and ATLAS\(^\mathrm{3D}\) data discussed in the previous sections. Such an analysis of 16 elliptical galaxies from SLACS was done by Barnabè et al. (2011), combining two-integral \(f(E,L_z)\) modeling of the lensing galaxy’s photometry and kinematics with the strong-lensing data from SLACS. Like the analyses discussed so far, they find that the total mass profile is approximately \(\rho(r) \propto r^{-2}\), but using SPS modeling of the observed spectra they also derive the inner dark-matter profile. This is shown for eight examples in Figure 16.14.
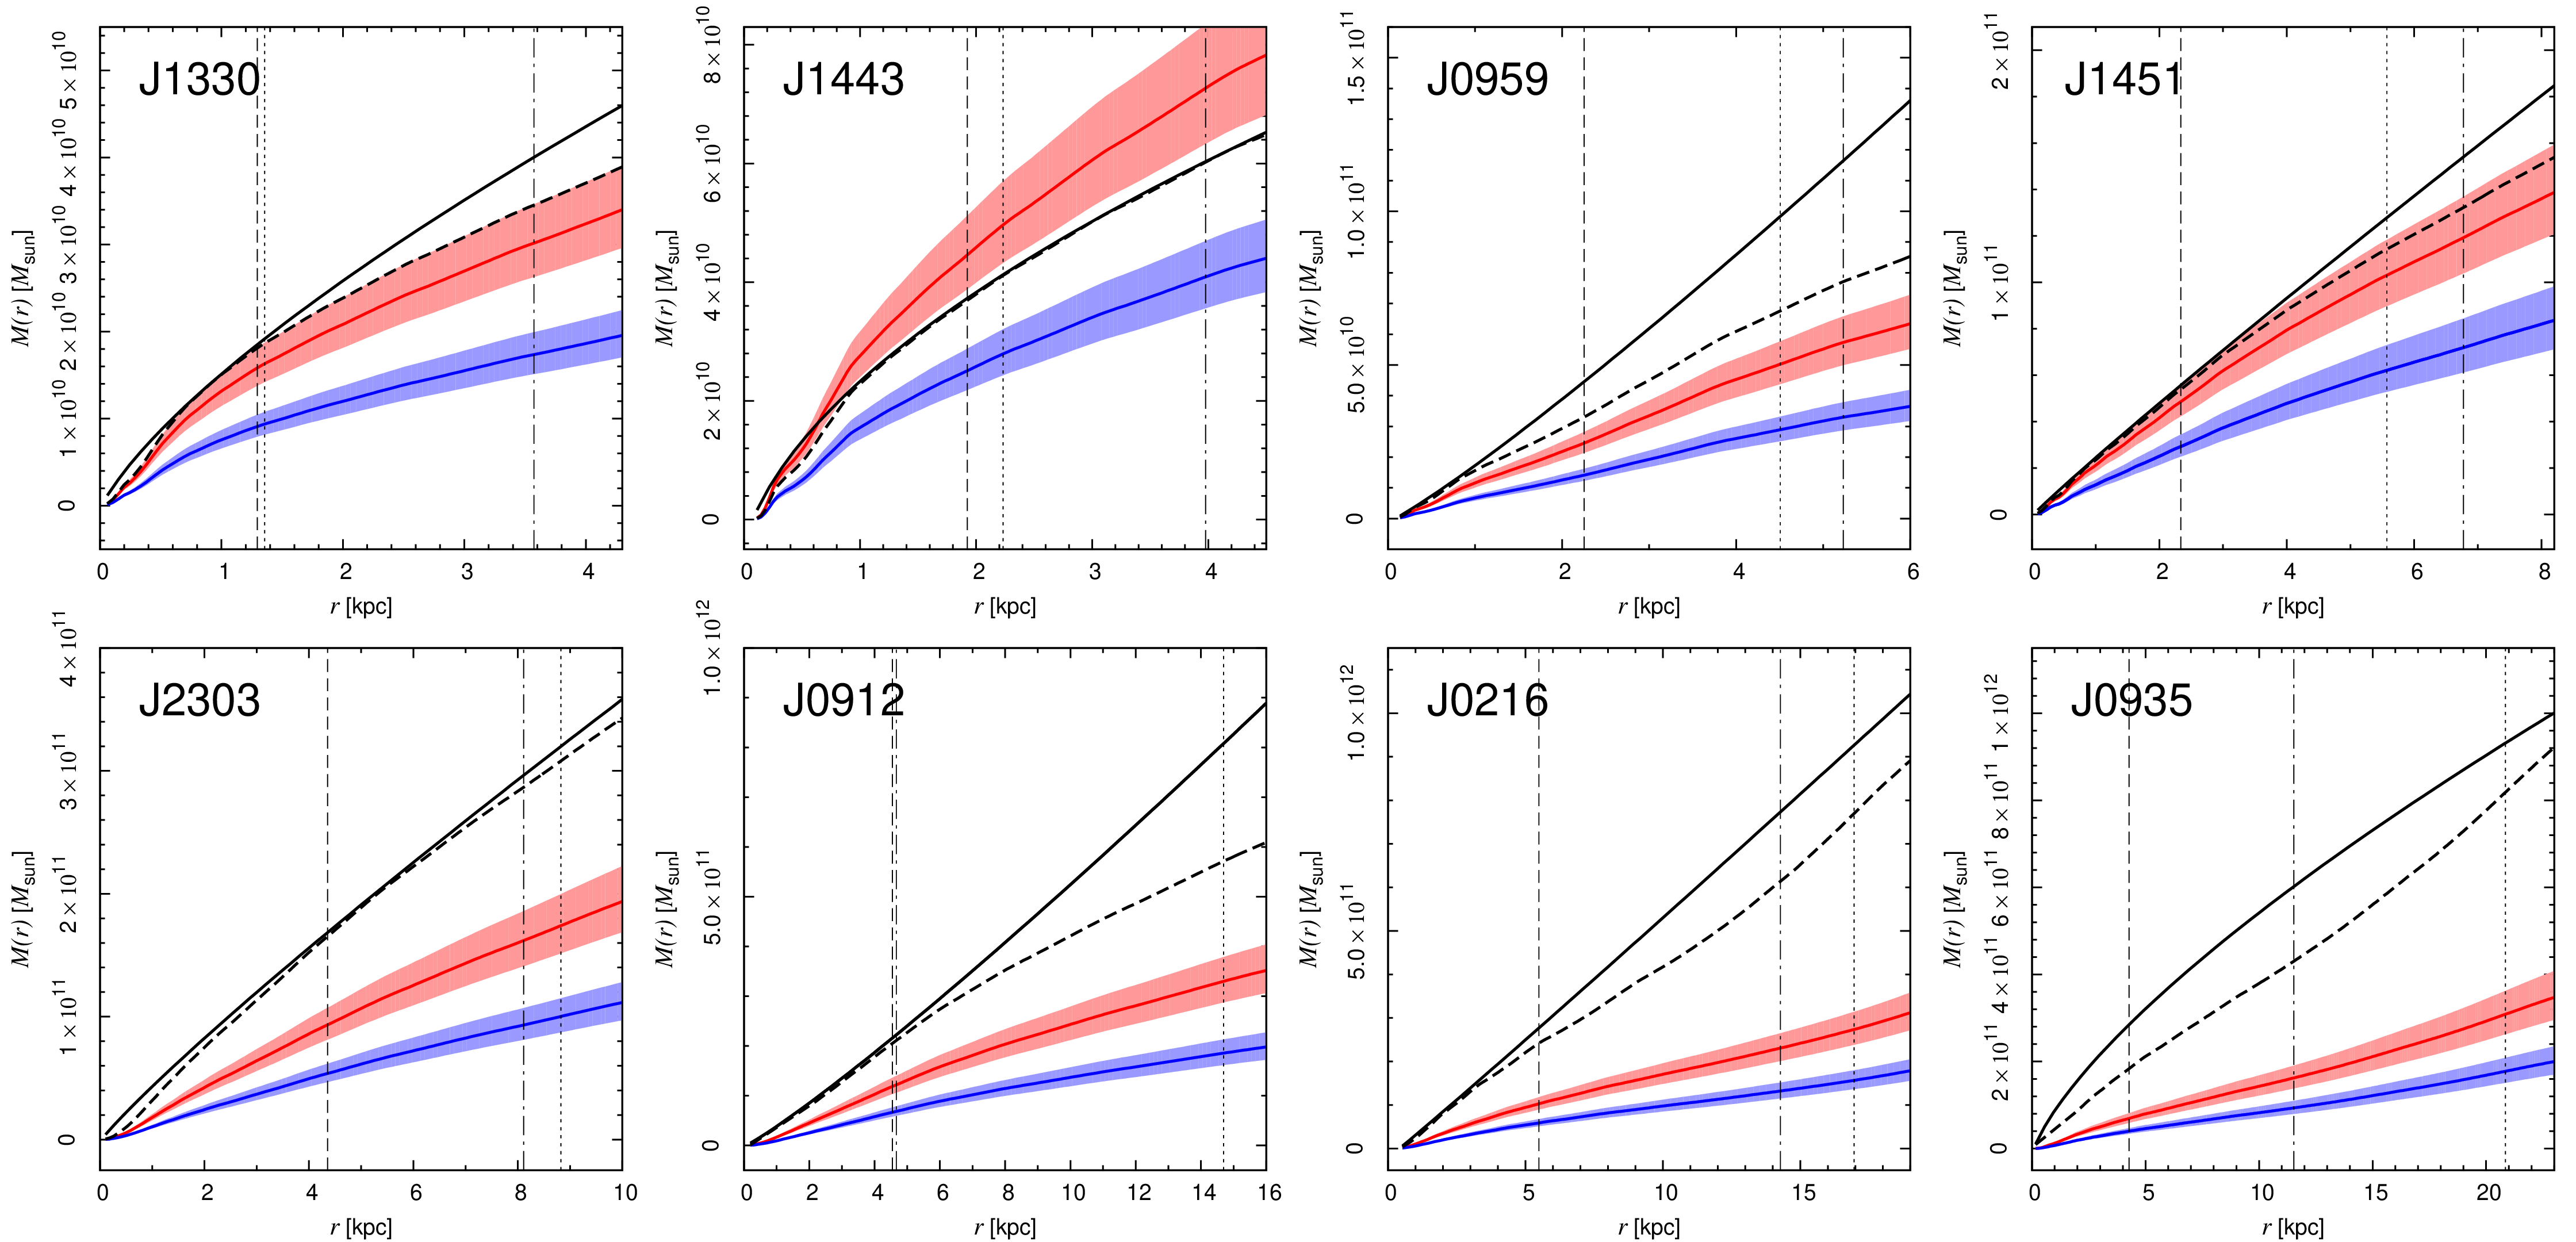
Figure 16.14: Total and stellar-mass profiles of selected ellipticals from lensing, dynamical, and SPS modeling (Barnabè et al. 2011).
The top row displays the four galaxies with the lowest total mass within the effective radius, while the lower row shows those with the highest mass (mass increases within each row). The solid line is the total enclosed mass profile, while the dashed line is a maximum-bulge fit and the red and blue curves are the stellar-mass contribution derived by two different SPS models (which differ in the assumed initial mass function (IMF) of stars, with the red being a classical Salpeter (1955) IMF and the blue line the more realistic Chabrier (2003) IMF). It is clear that even under the maximum-bulge hypothesis, there has to be a significant amount of dark matter within the radial range probed by the data and when adopting the more realistic SPS stellar masses, most elliptical galaxies require large amounts of dark matter in their inner regions and dark matter indeed dominates the mass budget within the effective radius (the dotted vertical line in each panel). The increasing trend in dark-matter fraction within the effective radius with galaxy mass that is very apparent in Figure 16.14 is consistent with the increasing total mass-to-light ratio with velocity dispersion found by Cappellari et al. (2006) that we discussed in Section 16.2 above. Lensing therefore provides further evidence that the tilt of the fundamental plane is caused by differences in the dark-matter fraction or equivalently, total mass-to-light ratio, rather than differences in the orbital structure among elliptical galaxies (Bolton et al. 2008b).
A second way to determine the dark matter fraction in the inner regions of elliptical galaxies is to determine the stellar mass and the stellar mass-to-light ratio not using SPS modeling, but instead using microlensing. As we discussed in Chapter 15.2.3, stars in external galaxies are able to produce multiple images for sources that are smaller than \(\approx 0.05\,\mathrm{pc}\). The innermost, unresolved regions of multiply-imaged quasars are small enough for this to be possible. Such multiple images have microarcsecond-scale offsets between the images, which cannot be resolved using any telescope, but the relative movement between the source and the lens stars causes a time-dependent magnification pattern as the source moves in areas of different magnification of the foreground lens (Chang & Refsdal 1979). These microlensing-induced changes to the magnification have typical time scales of one to ten years and they can be observed either by monitoring the flux of multiply-imaged quasars over many years (e.g., Schechter & Wambsganss 2002; Kochanek 2004) or by comparing the magnification at a single time with that predicted by a smooth (i.e., without point-source stars) lens mass model (Schechter et al. 2014; in this case one has to, of course, be quite certain a priori that magnification differences are solely due to microlensing by stars rather than any other non-smoothness in the lensing potential).
Predicting the microlensing magnifications is complicated by the fact that elliptical lenses do not consist of a single star, but instead have up to trillions of stars. Each star has an Einstein radius \(\approx 0.05\,\mathrm{pc}\), which is similar to the typical projected separation between stars in the centers of elliptical galaxies. Therefore, any location in the image plane generally lies within a small number of overlapping Einstein rings and the optical depth to this type of microlensing—the probability that a source is microlensed—is large (Paczynski 1986a). This produces a complex pattern of magnifications as a source moves across the lens and this combined with the fact that the intrinsic quasar flux itself varies in a complex manner means that modeling the time dependence of the observed flux is difficult and must be done numerically (typically using inverse ray tracing, following rays back from the observer to the source, because the lensing equation is simple in this case; Kayser et al. 1986). Because we have no prior information on the relative configuration of stars in the lensing galaxy, fits to observed magnification patterns have to be done by brute force, attempting many different variations of a random star field. An example of the complex magnification pattern near two of the images of the four-image (quad) quasar Q2237+0305 that best fit its observed light curve is displayed in Figure 16.15 (each source image moves along the line starting from the open circle).
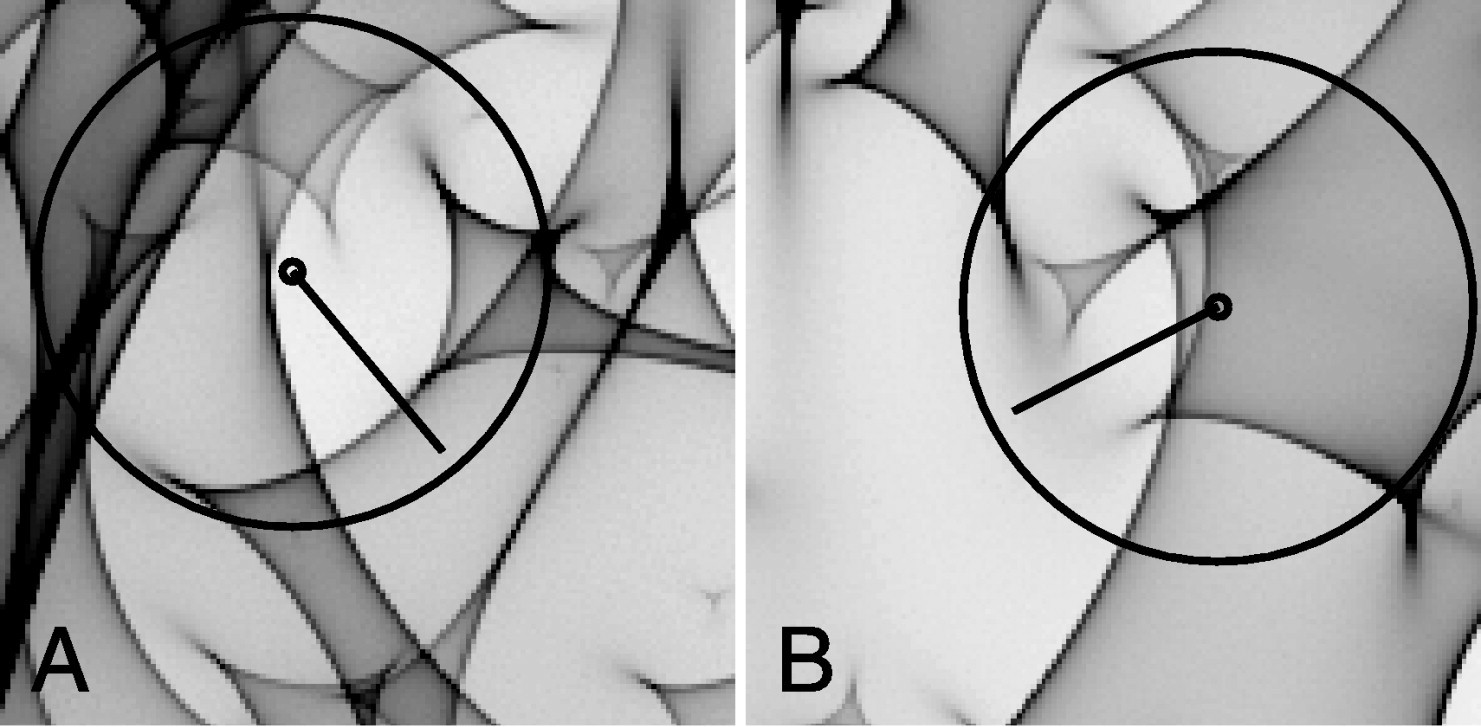
Figure 16.15: Microlensing magnification patterns in lensed quasar light curves (Kochanek 2004).
While microlensing by stars in external galaxies is in principle sensitive to the distribution of the masses of the individual stars (Schechter et al. 2004), this dependence in practice is weak and the predicted pattern and frequency of magnification events mainly depends on the total stellar surface density (e.g., Paczynski 1986a; Wyithe et al. 2000a; Kochanek 2004). Microlensing is then a great alternative tool to determine the stellar mass and the stellar mass-to-light ratio in elliptical galaxies. For example, Schechter et al. (2014) use the difference between the magnifications of point-like sources predicted by smooth mass models and the observed relative magnifications of X-ray images of multiply-imaged quasars to calibrate mass-to-light ratios obtained using SPS models computed using a Salpeter (1955) IMF. They find that such mass-to-light ratios need to be increased by a factor of 1.23 with a 68% confidence region extending from 0.77 to 2.10. Applying this scaling to the red curve in the figure from Barnabè et al. (2011) above, we see that the stellar contribution may be somewhat larger than estimated there, but it still leaves much dark matter in the inner regions of massive elliptical galaxies. The galaxies used by Schechter et al. (2014) have high velocity dispersions of \(\sigma \gtrsim 200\,\mathrm{km\,s}^{-1}\). A mass-to-light ratio higher than Salpeter means that there are more low-mass stars than in the Salpeter (1955) IMF and such IMFs are therefore known as bottom heavy IMFs. The direct microlensing evidence for an increasingly bottom-heavy IMF in massive ellipticals is consistent with conclusions about the IMF drawn from smooth strong lensing modeling (Treu et al. 2010), dynamical modeling of the ATLAS\(^\mathrm{3D}\) galaxies (Cappellari et al. 2012), and detailed SPS modeling of absorption features in galaxy spectra sensitive to low-mass stars (Conroy & van Dokkum 2012b).

 .
. .
. .
.