
7.1. The observed structure of disk galaxies
We briefly introduced the structure of disk galaxies in Chapter 1.2. To motivate our discussion of good mass models for disk galaxies, we look at the observations in a little more detail first.
As discussed in Chapter 1.2.1, the radial surface-brightness profile of disk galaxies is overall well described by an exponential function: \begin{equation} I(R) = I_0\,\exp\left(-R/h_R\right)\,, \end{equation} where \(h_R\) is a parameter called the scale length. Thus, we say that galactic disks are exponential disks. Many decades have passed since Freeman (1970)’s paper in which he first described the exponential nature of galactic disks and we now have photometry for millions of galaxies from surveys such as the Sloan Digital Sky Survey (SDSS) that allow us to investigate the exponential nature of the light distribution in detail. Figure 7.2 shows the main different types of profiles for disk galaxies.
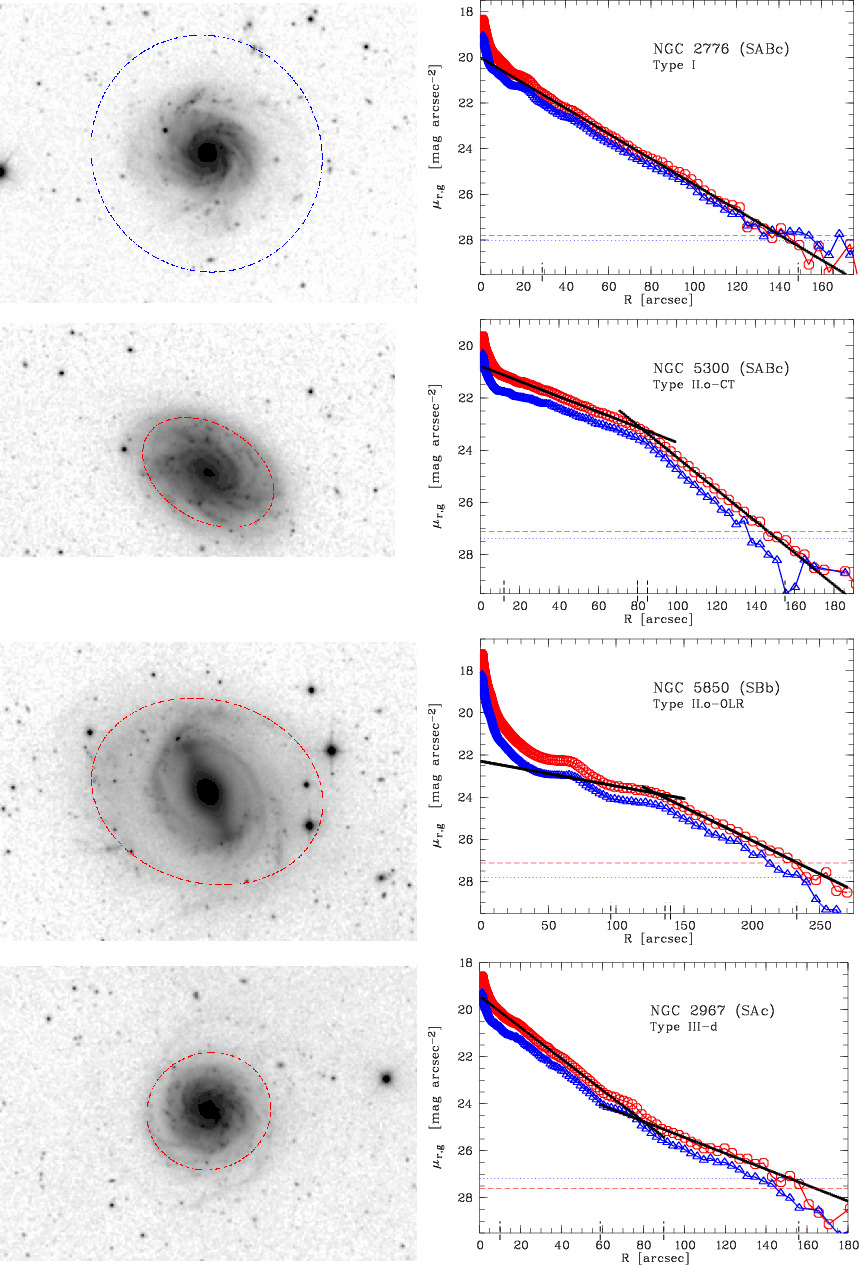
Figure 7.2: Surface-brightness profiles of disk galaxies (Pohlen & Trujillo 2006). Left panels: r’-band SDSS cut-outs (ellipse: noise limit \(\approx 140\) arcsec); right panels: azimuthally averaged, radial surface-brightness profiles in g’ (triangles) and r’ (circles) with a fit in black.
The galaxy shown in the top panels, NGC 2776, has a pure exponential profile (known as a type I profile): an exponential decline without any change of (logarithmic) slope from the center to the very outskirts of the galaxy, except for a small central concentration. The other panels display galaxies with more complicated profiles, either a break towards a steeper decline in the outer parts of the galaxy (type II profiles) or a break to a more shallow profile (type III). While there are these different types, the main thing to remember is that all galactic disks have to first approximation exponential profiles.
To take observations of the surface-brightness profiles of disk galaxies and jump to the conclusion that the distribution of stellar mass in disks declines exponentially requires an additional assumption. We have to assume that stellar mass traces observed luminosity with a constant scaling, the mass-to-light ratio. This allows us to convert the observed luminosity to stellar mass and determine the mass profile. As discussed in Chapter 1.2.1, the mass-to-light ratio is normally expressed in solar units of (solar mass)/(solar luminosity) and is typically a few in these units. The exact value varies somewhat between different photometric bandpasses, which is ultimately caused by the fact that light is a very biased tracer of mass: the light in most bands is dominated by luminous, relatively high-mass stars (mass of the Sun or higher), while the mass budget is dominated by the lowest mass stars (far below the mass of the Sun). It is therefore not obvious that the stellar mass profiles of disks are also exponential. However, in the Milky Way we can measure the amount of mass contained in the disk directly at different distances from the Galactic center (Bovy & Rix 2013). The measured surface-mass profile is very well represented by an exponential and it therefore does seem to be the case that the stellar mass distribution itself is exponential and that mass-to-light ratios cannot vary too much with radius. But the disconnect between mass and light is important to keep in mind in all of the discussions of mass distributions in this book.
In Chapter 1.2.1, we also discussed how the distribution of stars in the direction vertical to the disk plane is well described by a \(\mathrm{sech}^2\) profile. In cylindrical coordinates, the vertical direction is denoted as \(z\) and the \(\mathrm{sech}^2\) profile is: \begin{equation} \mathrm{sech}^2\left(\frac{z}{2\,h_z}\right) = 4\,\left[\exp\left(\frac{z}{2\,h_z}\right)+\exp\left(-\frac{z}{2\,h_z}\right)\right]^{-2}\,, \end{equation} where \(h_z\) is a parameter called the scale height. An example of the vertical profile of a disk galaxy is furnished by the observations of NGC 4244 shown in Figure 1.9. At distances \(z \gg h_z\), the profile becomes \begin{align} \lim_{z \gg h_z} \mathrm{sech}^2\left[\frac{z}{2\,h_z}\right] & = \lim_{z \gg h_z} 4\,\left[\exp\left(\frac{z}{2\,h_z}\right)+\exp\left(-\frac{z}{2\,h_z}\right)\right]^{-2} = 4\,\exp\left(-\frac{|z|}{h_z}\right)\,. \end{align} Thus, the profile becomes an exponential with an exponential scale height equal to \(h_z\). Ignoring the detailed density profile near the mid-plane, a simple, axisymmetric approximation to the number density profile \(n(R,z)\) in disk galaxies is therefore that they are exponential both in radius \(R\) and height \(|z|\) with scale lengths/heights \(h_R\) and \(h_z\): \begin{equation} n(R,z) \propto \exp\left(-\frac{R}{h_R}-\frac{|z|}{h_z}\right)\,. \end{equation} This is the double-exponential disk profile. In principle, the scale height \(h_z\) could depend on the radial position \(R\), but many observations like the one shown in Figure 1.9 demonstrate that at least the overall thickness of the stellar mass distribution in disk galaxies is constant with \(R\). Thus, the double-exponential disk profile is an excellent approximation of the stellar density distribution in a typical disk.
In the Milky Way and near the Sun we can measure the vertical profile of stars in exquisite detail. Unlike in most external galaxies, in the Milky Way we can count individual stars and are therefore not limited to making sense of the integrated light of stars (which is dominated by rare, luminous stars). The three panels in Figure 7.3 display the vertical number density of stars near the Sun from SDSS.
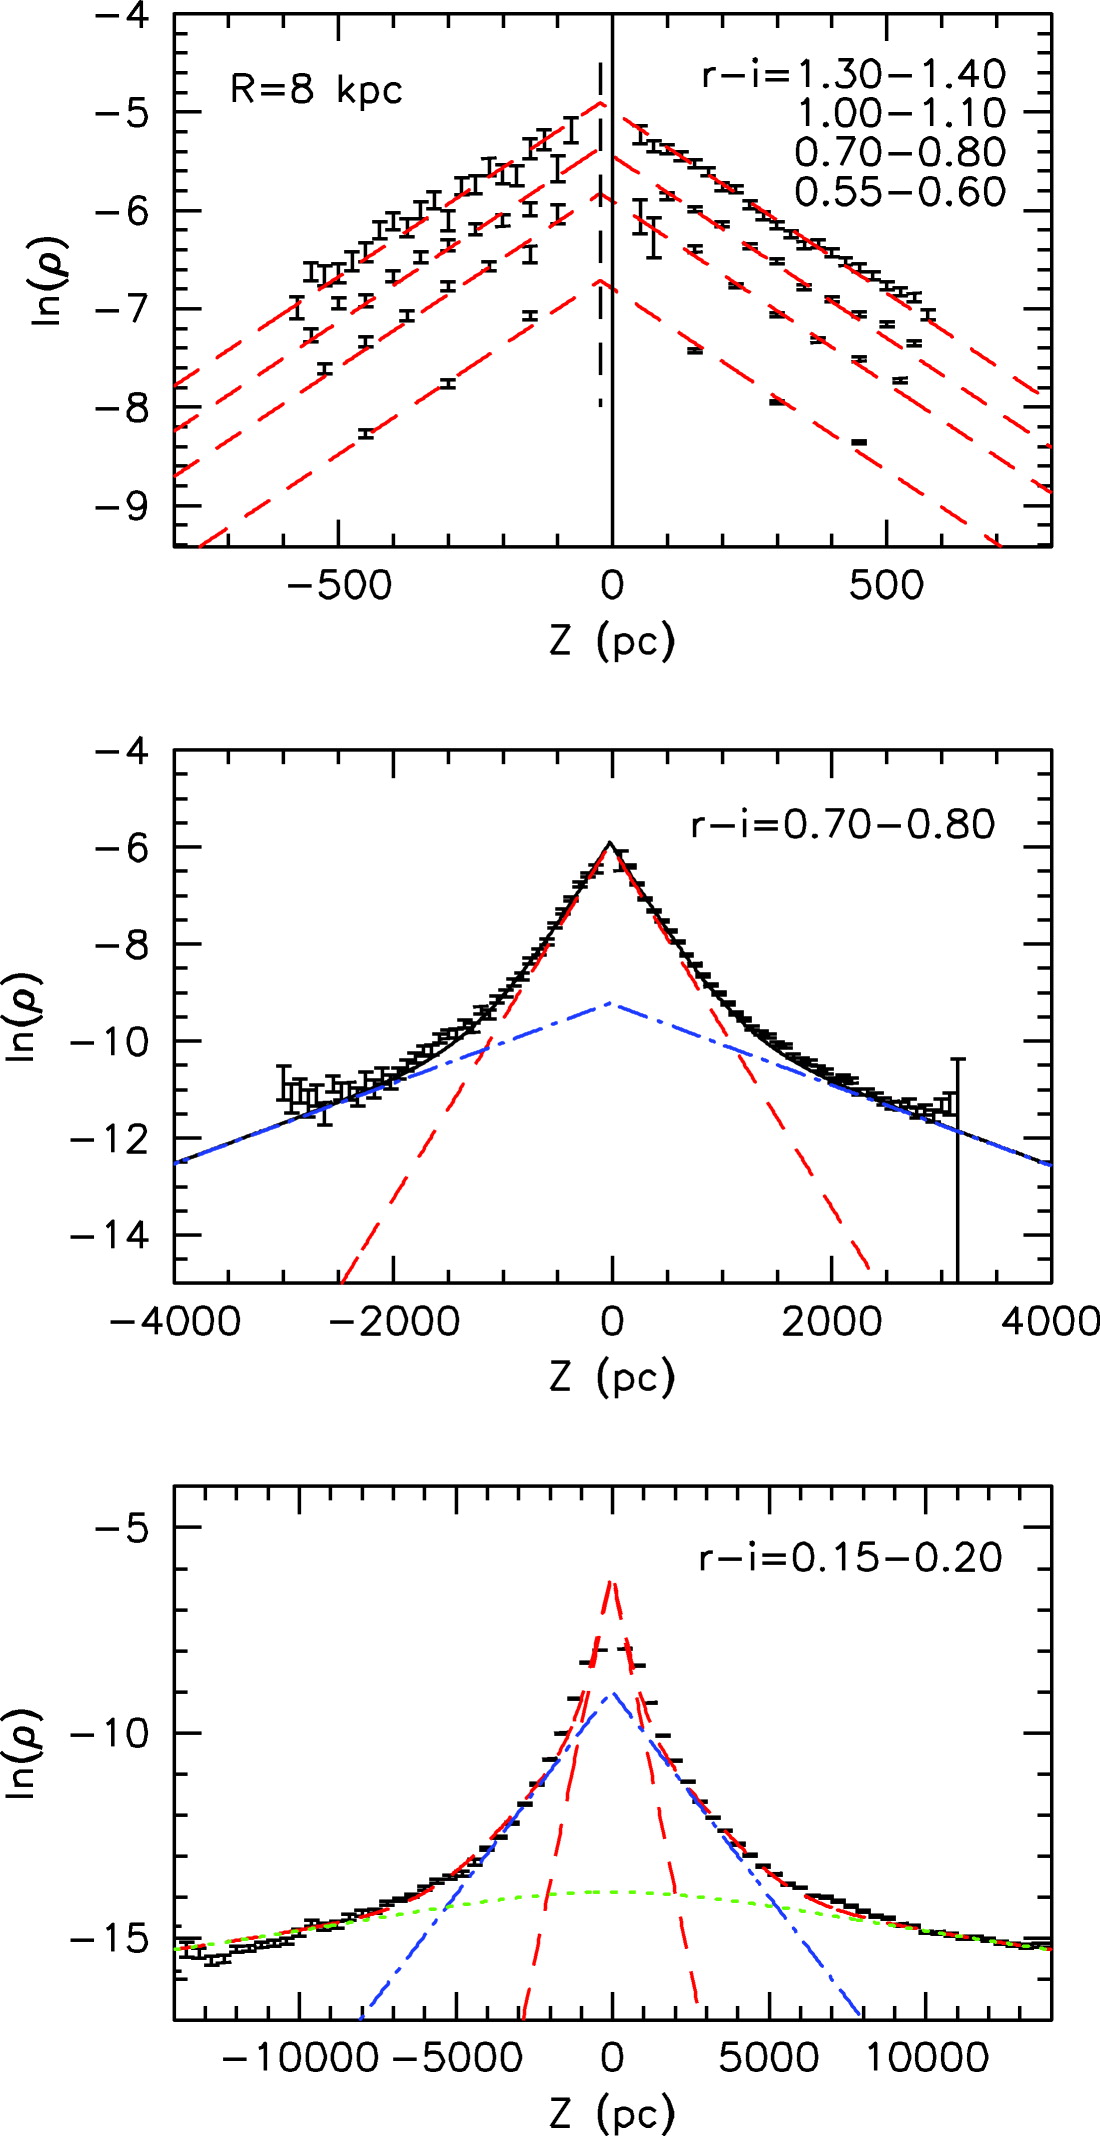
Figure 7.3: Stellar number counts as a function of height using different stellar tracer populations in the solar neighborhood (Juric et al. 2008).
The different panels show different vertical ranges, with the top panel the closest to the mid-plane. Stars with different colors \(r-i\) are used to determine the number counts at different heights: the redder stars are dimmer and, in a magnitude-limited survey such as SDSS, found closer to the Sun (which sits close to the mid-plane); the bluer stars are brighter and can be seen to multiple kpc (bottom panel). The top panel shows that the number density is close to exponential within a few 100 pc, although the middle panel shows a turnover towards a shallower profile (sometimes called a “thick disk”, although the author of this book strongly disagrees with this terminology; Bovy et al. 2012). Even though the stellar profile looks perfectly exponential in the top panel, detailed number counts within 100 pc of the mid-plane demonstrate that the stellar profile flattens as it reaches the mid-plane (e.g., Bovy 2017b; Bennett & Bovy 2019).
Thus, to a first approximation, we can model the stellar mass distribution in disk galaxies using the double-exponential disk profile. Depending on the context, the most important deviations from this profile are that (a) near the disk mid-plane the vertical density flattens and is better described as a \(\mathrm{sech}^2\) profile, (b) far from the mid-plane the vertical density requires at least another, thicker exponential component to account for the detailed vertical distribution of stars of different ages, and (c) the radial profile may deviate from the pure exponential profile in the inner or outer ranges of the disk.

 .
. .
. .
.